Web apps are now more interactive than ever & the performance of the apps matters now more than ever. Getting that last drop of performance can do a great deal to improve end-users’ experience.
Every day thousands of organizations are using their websites for:
- Branding
- Products and services information
- Customer information collection
- Customer services
- Loyalty programs
- Sales

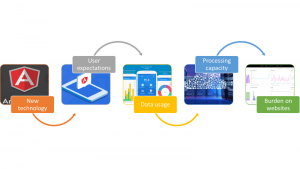
As new technologies are introduced, user expectations rise. The amount of data being used, shared and processed are increasing, putting heavier burdens on websites. At the same time, the user expects their experience to be quick and seamless. Delivering the experience to customers expect is a critical part of supporting a user base and growing a business.

It is undeniable that technology and marketing show great interest in activities associated with web performance optimization processes. Out there we can read about web speed tools, minimizing CCS and JS files, tips for web server configuration, etc.
Therefore, web application performance has become a key element for the proper functioning of organizations.

Web Performance Indicators
The web performance indicators are used to concentrate our optimization efforts on the really important elements and to evaluate the achievements in the optimization process.
If you only measure the speed and number of visitors, you probably are working with the wrong indicators.

Page Load Time
This is one of the key metrics in monitoring web performance, as today everything revolves around speed. Milliseconds translate to dollars earned or lost. Page load time measures the time it takes to load content on a web page when the user clicks a link or types a web address.
47% of consumers today expect web pages to load in 2 seconds or less.
Time to Title
The period between the moment a visitor requests your website and the moment your site title appears in their browser tab is called the Time to Title. Seeing a title immediately lets the user know that your website is legitimate, making it more likely that they will wait for the entire page to finish loading.
 Start Render Time
Start Render Time is the first moment that something is displayed on the screen, even before the page content starts to load. In fact, it could be something as simple as a background color. But it is the first indication that something is happening on a website.
Bounce Rate
The bounce rate measures the percentage of website visitors who leave the site navigation after viewing only one page. A high bounce rate usually means that visitors are visiting your website, but slow page speeds can hurt the user experience. Insufficient content and poor design can also affect the bounce rate.
Time to Interact
Interaction time is defined as the time between when the user clicks a link, type in a text field, scroll the page or perform an operation on the page. During the interactive period, certain elements (such as scripts and trackers) may continue to load.
Requests Per Second
Requests per second is a key performance indicator that tells you how many operations per second are sent to the target server. The request can be regarded as any interaction with the resources on the page-HTML pages, images, multimedia files, database queries, etc.
Overall Weight
The total number of bytes received by the user is called the overall weight of the website. More important than total weight is the relationship between each asset, because one heavy asset may slow down all other assets. In recent years, the size of web pages has grown exponentially.
Error Rate
The error rate is a measure of the percentage of problematic requests. If you see a spike in the error rate at some point during the load test, it means that there is some reason that prevents the application from running properly. This is valuable information and you need to have a clear understanding of.
A one-second delay in page response may result in a 7% reduction in conversions.
Peak Response Time
This is a metric that analyzes anomalies within the average response time showing items that are taking longer than normal to load. This metric offers a very useful way to identify slower-than-normal applications that need to be investigated further.
Connection Time
The time between a request and when a connection is established between the user’s browser and its origin server is called the connection time. Identifying online time challenges can be difficult because it depends on many factors. For example, too much traffic on the server can cause connection times to increase.
Key Ideas to Improve Website Speed
Acceleration
Cache static resources using caching servers spread across a region or around the world. This brings those resources closer to your users and reduces the amount of time it takes for a server to receive and deliver a request. If the origin web servers are down, the regional nodes will deliver reusable static and dynamic content to ensure an uninterrupted experience for their users.
Additionally, a web accelerator can accelerate delivery through various techniques, including data compression, code optimization, filtering for unwanted objects, and maintaining consistent TCP connections between the client and the proxy server.
Know your Web Application
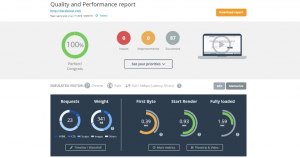
The next step in optimizing a web application is knowing how it is performing. Running a web application through a performance audit produces actionable results in minutes. Trading tools like Pingdom, Silk, and Uptrends are free to try and offer tiered pricing based on your needs. These tools typically provide a summary page with basic information about your site’s load time, page size, the number of requests required for the page to load, etc.
Consider Web Performance
Like any other aspect of application design, achieving consistent web performance requires intention. At the beginning of the design phase, take a few minutes to discuss how design choices can affect speed and performance.
Developers and testers should raise their concerns early in the process to avoid making more costly changes later in development if unforeseen performance issues arise. Setting performance goals or targets for your site based on previous benchmarks or improvement targets can help guide decisions.
Testing performance during development is also helpful in determining which changes have the greatest impact, positive or negative, on your site’s performance. Also, the phrase “works on my machine” does not belong here; be sure to test and audit website performance outside of your development environment.
Dynamic Content Caching
Going a step beyond simple regional distribution, dynamic content caching is when the first instance of a dynamically generated web page is stored and additional requests to that same page go to the cache, rather than generating the page again.
In this context, an important metric is dynamic cache control. This increases a website’s cache hit ratio, that is, the amount of content that is delivered from a cache compared to origin servers. The higher the ratio, the faster your content will reach your users.
Fast Connectivity
Networks are often the least advanced segment of an IT property. However, web applications can only be as fast and secure as the network on which they are delivered. Make sure your network is reliable and secure.
If your web application is private, maximize its potential by delivering your content over a private MPLS network; Avoid the vagaries of the public Internet whenever possible.
Scale
You can have the fastest car in the world but if the roads cannot handle the traffic, you are not going anywhere. It does not matter how optimized your web application is if it cannot scale properly.
SSL Download and Optimization
SSL offloading prevents a web server from having to encrypt and decrypt web traffic sent over SSL. Instead, this is done using a separate device specifically designed for the task. This reduces expenses and makes your solution more scalable.
Explore the Public Cloud
The public cloud is a hosting service that can be extended using APIs. This means that the new servers do not need to be activated or deactivated manually; the process is automatic.
Availability
You need to make sure your content is accessible as easily as possible.
Multiple Node Replication
Present your website with a highly available content delivery network (CDN) service that supports multi-node replication. For example, if someone in Germany accesses “domain.com”, the CDN will recognize the user’s location and redirect them to “domain.de” accordingly, resulting in much better performance for the user.
Local and Global Load Balancing
Load balancers distribute the traffic so that the traffic load is equally distributed among the available servers. This results in better uptime, better response times and higher performance. Local load balancing distributes traffic between local servers. Global load balancing distributes traffic between data centers.
Multi-node Disaster Recovery
If your content is spread across multiple nodes, global load balancing between them also enables the benefits of disaster recovery. Imagine a company with two data centers. If an individual server fails within one data center, traffic can be redirected to a parallel server at the second site. If the entire data center fails, similarly, traffic can be seamlessly redirected to the second data center.
Protection
Beyond taking measures to improve performance, you can also implement measures that prevent performance from being adversely affected by external forces.
Web Application Firewall
Use a web application firewall to filter out unwanted requests, this will free up web server resources and improve the performance of your application.
DoS Mitigation
Redirect your traffic to pass through a specially designed DoS protection platform, which monitors and analyzes traffic data patterns in real-time. When a DoS attack is detected, traffic is directed to the nearest “cleanup” where “good” traffic is filtered from “bad” and routed to minimize the impact of the DoS attack. The clean traffic is then redirected back to the customer’s network.
This technique is not only highly effective, but it also reduces the need for expensive hardware and means you avoid wasting time setting up complicated instruments like routers or firewalls.
By working with a provider that has access to a larger network, you will be able to absorb more traffic and protect your customers from larger DoS attacks than the customer could have handled on their own.
Monitor Application Performance Regularly
The last one and important point is to remain with high-performance. Web applications must be regularly monitored and adjusted for optimization, as necessary. There are several tools available for regular monitoring of web performance and many of them can be easily integrated into development and reporting tools.
The tools for the job depends on the needs and capabilities of the product and the product team. Some products are ready to go right out of the box, while others require time and multiple setup attempts to achieve maximum benefit.
In order not to get lost in the middle of so much information, it is recommended to take into account the goals, conversion and the actual behavior of the website when choosing the group of indicators to work within a web performance optimization process.