JMeter listeners are used for viewing the results of the performance testing of several API endpoints of a selected application. These JMeters allows us to view test results in various forms such as tables, graphs, trees, log files, etc.
The most common JMeter listeners are as follow.
- View Result tree
- View Result in Table
- Assertion Results
- Aggregate Graph
- Aggregate report
- View Result Tree
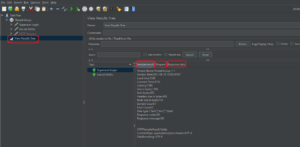
After creating all the tests, the Tester can add View Result Tree for the thread Group that he has created or for the whole test plan. View Results Tree allows us to view the result using different samplers of JMeter which are used and selected by the Tester.
As an example, if the user uses the HTTPS sampler request, the View Result Tree Listener shows Sampler Result, Request and Response Data as shown below.
By using the following steps tester can add the View Result Tree listener to the test plan. At first, right-click on Test Plan. Then go to add >> Listeners >> View Result Tree.
- View Result in Table
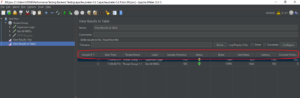
View Result in Table is another mostly used listener type in JMeter. As the name itself says this listener gives a tabular view of the result of selected samplers. The table consists of, the number of the sample, start time, Thread Name, Label, Sample Time, Status, Bytes used, Sent Bytes, Latency (the amount of time a message takes to traverse a system) and Connect time.
To add View Result in Table listener user can follow the same steps used to add View Result Tree. In Listeners, there is an option called View Result in Table.
- Assertion Results
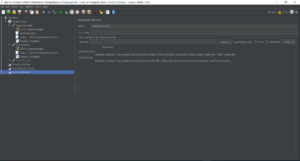
Assertions Results Listener is used to view the result of the sampler which contains assertion(s). There are different types of assertions testers can use in JMeter. Some of them are Response assertions, Duration assertions, Size assertions, XML assertions etc.
The following screenshot shows a result of duration assertion. If the sampler takes more than the time defined in the duration assertion that sampler is considered as a failed test.
- Aggregate Graph
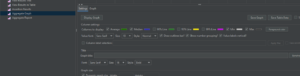
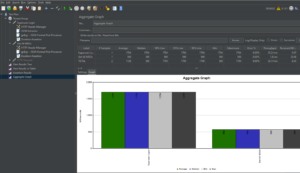
Testers can use Aggregate Graph Listener to get a graphical view of the response time of selected samplers. JMeter allows testers to change the settings as per the requirement of the tester. In settings, the section tester can change which columns the tester wants to display by selecting or deselecting options such as Average, Median, 90% Line, 95% Line, 99% Line, Min, Max.
An example screenshot of the aggregate graph is shown below to show how it looks like.
- Aggregate Report
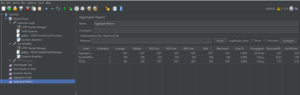
Aggregate Report Listener is used for generating an aggregate report in a tabular format. One row of the table is one sample request result. The results table shows columns having aggregate data of Average, Median, 90% line, 95% line, 99% line, Min, Maximum, Throughput, etc.
The below screenshot shows a sample aggregate report generated for the test plan which consists of two samplers.
Except above discussed JMeter Listeners, there are other listeners testers that can use in JMeter which are Summary report, Back-end Listener, Comparison Assertion Visualizer, JSR223 Listener, simple data writer, Response Time Graph, Mailer Visualizer, etc.